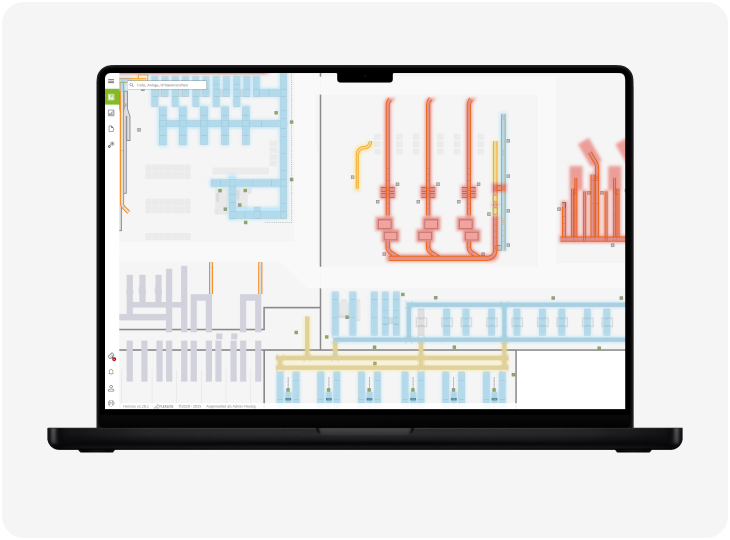
Many logistics facilities do not immediately detect system issues. Errors result in the loss of critical data, causing disruptions to persist until they are identified and resolved. Without intuitive, powerful visualization, important information remains hidden, which can lead to higher maintenance costs and lost productivity.
Our FLEXLOG HORIZON visu module clearly displays all relevant equipment and system statuses of your intralogistics facility in real time via dashboards.
Keep track of all material flows, equipment, and sensors in real time and with precision at all times. Identify disruptions or bottlenecks immediately and take targeted action before they impact your operations.
Use the visualization not only for monitoring, but also to control individual systems directly via your smartphone, without having to go through other systems.
All visualization data can be seamlessly integrated into your management dashboard, ensuring that everyone involved is always on the same page.
Critical conditions are highlighted in color and are immediately visible in the system. This allows you to respond more quickly and minimize downtime.
From the facility level down to the sensor-actuator level
Whether you’re looking at an overview of the facility or a single sensor, you can zoom in to the desired level of detail and get exactly the information you need.
Switch from manual mode to maintenance mode
Start, stop, or control motors and devices directly within the visualization interface. No need to switch systems. No detours. With a single click, you can immediately view the desired mode, including current maintenance statuses.
Recognize conditions immediately
No issue goes unnoticed. Critical conditions are immediately highlighted visually in your view. Customizable for each system and device. This way, you won’t miss a single notification and can respond quickly.
Prioritization made easy
Risk Mode helps you stay on top of things and make the right decisions. You can immediately identify which issue has the greatest impact on the overall process. Critical areas are highlighted in color, making priorities clear at a glance. This allows you to take targeted action and minimize downtime.
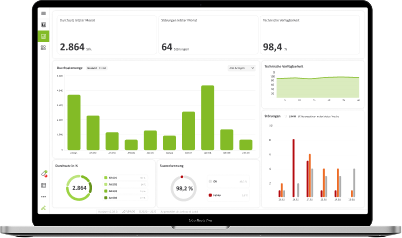
Monitor your facilities, processes, and material flows at a glance on a central dashboard.
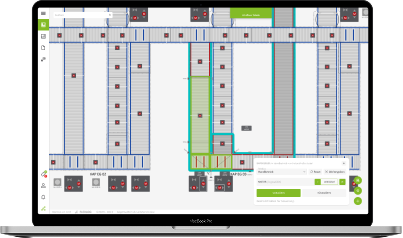
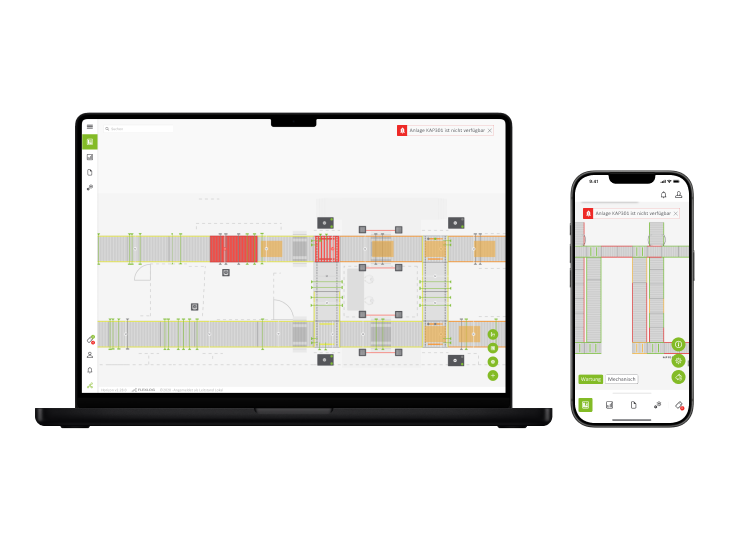
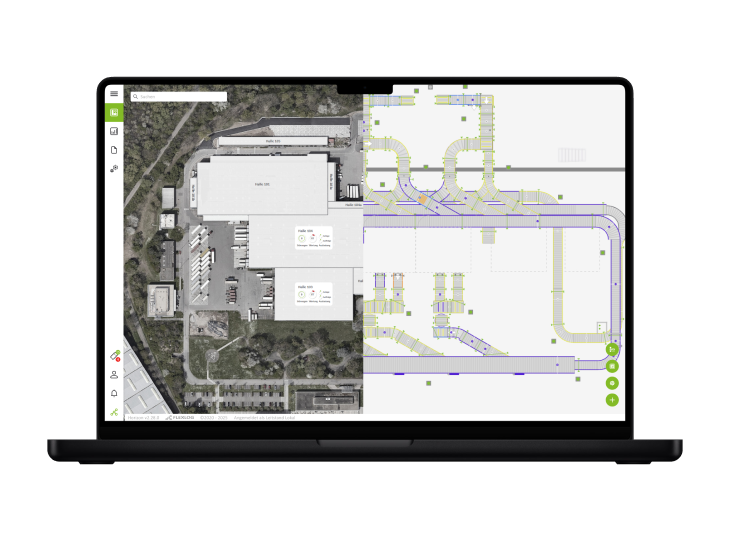
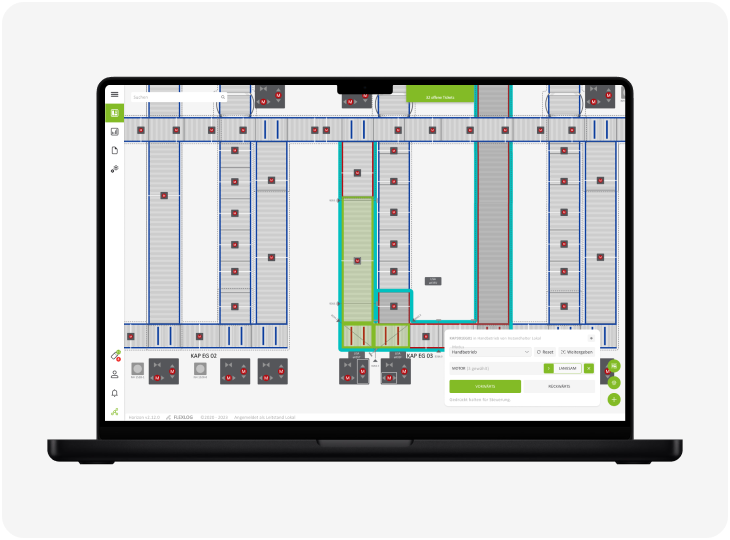
A holistic solution for your control system.
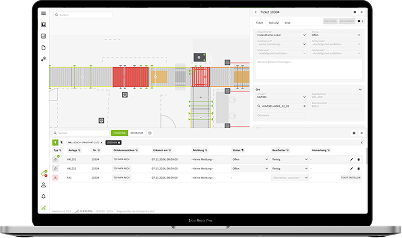
Statistics, reports, and trend analyses for rapid identification of weaknesses and process optimization.